Guides
Retool Table Custom Aggregation for the Summary Row
If you've tried to add a custom aggregation to a Retool table summary row, you've probably hit the same wall everyone else does: the dropdown gives you sum, average, min, max, count, and not much else. There's no text field, no JavaScript hook, no way to write (columnA / columnB) or calculate a weighted average across a group. This is one of the most upvoted open feature requests in the Retool community, and if you're building internal tools with complex reporting tables, it matters a lot.
What the Built-In Summary Row Can and Can't Do
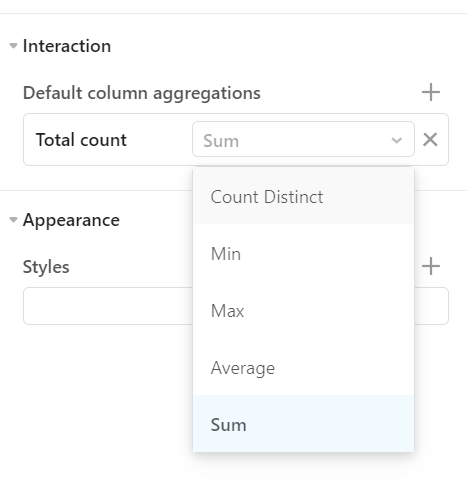
The Retool table component's summary row lets you display an aggregated value at the bottom of a column. Out of the box, it supports:
sum— adds all values in the columnaverage— divides the sum by the count of rowsmin— returns the smallest valuemax— returns the largest valuecount— counts the number of rows
What it cannot do natively: run a JavaScript expression, reference values from other columns, ignore NULL values correctly in averages, or compute anything derived — like a ratio between two aggregated totals. Every one of those use cases requires a workaround today.
Why This Limitation Hurts Real Use Cases
The Retool community thread on this topic surfaced several concrete pain points that go beyond edge cases:
- Division between aggregated columns: One user needed to divide the sum of column A by the sum of column B for a summary metric. No built-in aggregation covers this.
- Boolean column aggregation: Another user needed an
ANDacross a boolean column — logically equivalent tominif you treatfalse = 0andtrue = 1. Theminworkaround works, but only if you know to think of it that way. - NULL handling in averages: The default
averageaggregation treatsNULLas0, which inflates denominators and produces wrong results. A custom aggregation would let you filter nulls before computing. - Grouped row subtotals from a separate query: When using grouped tables, the aggregated value shown in the group header row is calculated from individual cell values — not from a separate totals query. For columns with custom cell transformations, this produces incorrect group-level summaries.
Current Workarounds for Custom Table Aggregation in Retool
Until Retool ships native JavaScript support for summary row aggregations, here are the approaches that work today:
Option 1: Compute the Summary Value in Your Query
The most reliable approach is to calculate your custom aggregation in SQL or your backend, then surface it as a separate value. You can use a SELECT SUM(revenue) / SUM(cost) AS efficiency_ratio FROM orders query and display the result in a text component placed visually below the table. It's not inside the summary row, but it's accurate and easy to maintain.
Option 2: Use a JavaScript Query to Transform Table Data
If your aggregation logic is too dynamic for a static SQL query, write a JavaScript query in Retool that runs after your data query completes. Use it to compute the custom summary value and store it in a variable or display it in a separate component.
Example: to compute a weighted average while ignoring nulls, you might write:
const rows = {{ dataQuery.data }}; const valid = rows.filter(r => r.value !== null); const total = valid.reduce((sum, r) => sum + r.value, 0); return total / valid.length;
Bind the result to a statistic or text component positioned at the foot of your table to mimic a summary row visually.
Option 3: Abuse min/max for Boolean Columns
If you need to aggregate a boolean column, Retool's min and max aggregations follow JavaScript's numeric coercion rules where false = 0 and true = 1. This means:
minacts as a logical AND — returnsfalseif any value is falsemaxacts as a logical OR — returnstrueif any value is true
It's a hack, but it's a useful one when you're in a pinch.
Option 4: Replace the Summary Row with a Custom Footer Component
For tables where summary logic is genuinely complex, consider dropping the built-in summary row entirely. Build a second single-row table component with your custom-calculated totals row, style it to match your main table, and stack it directly below. You get full control over every cell's value and formatting.
What Retool Has Said About This Feature
As of the time this post was written, Retool's team has acknowledged the request and logged it internally. The community thread gathered votes for custom JavaScript-based aggregations, support for NULL-aware averaging, and the ability to pull summary values from a dedicated totals query rather than computing them from column values. No public timeline has been given, but the volume of +1s across multiple related threads suggests it's on the radar.
The Bottom Line
The Retool table custom aggregation summary row feature doesn't exist yet in its full form, but the workarounds above cover the majority of real-world use cases. Compute your summaries in SQL when you can, use JavaScript queries for dynamic logic, and lean on the min/max trick for booleans. If none of those fit, a custom footer table gives you the full flexibility of a Retool component with none of the summary row constraints. Watch the original community thread for updates when the native feature eventually ships.
Ready to build?
We scope, design, and ship your Retool app — fast.