Guides
Retool Pivot Table: How to Build One That Actually Works
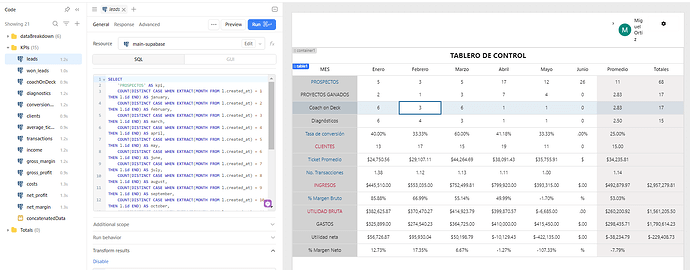
If you've tried to build a Retool pivot table — one that displays numbers, averages, and currency values across different columns in a single table — you've probably hit the same wall. Retool's native Table component enforces a single column type, which makes mixed-type visualizations painful. This guide covers the real-world workarounds Retool developers are using right now, from JavaScript string formatting to custom components powered by pivot.js.
Why Retool Doesn't Have a Native Pivot Table (Yet)
Retool's Table component is built around uniform column types — each column gets one format: number, string, currency, etc. That's fine for simple datasets, but falls apart the moment you need a single table to show, say, monthly revenue (currency), average deal size (number with decimals), and conversion rate (percentage) all in one view. This is a known gap. Retool community members have been requesting a flexible table or pivot component for years, and in the meantime, builders have had to get creative.
Option 1: Format Everything as Strings in SQL or JavaScript
The most common first approach is to pre-format all your data before it reaches the Table component, so every column is typed as a string. This lets you display $1,200.00, 43.2%, and 18 in the same table without fighting Retool's column type system.
You can do this in SQL directly, casting and formatting values server-side. Or you can do it in a JavaScript transformer after your query runs. Here's a reusable JavaScript snippet for coercing values to strings before they hit the table:
var return_value = "";
switch (typeof input1) {
  case 'string':
    return_value = input1;
    break;
  case 'number':
    return_value = input1.toString();
    break;
  default:
    return_value = String(input1);
    break;
}
return return_value;
If you're doing this across many columns, consider writing a PostgreSQL function like sqlToString(input) and creating a view from it. This pushes the formatting work to the database layer and keeps your Retool queries clean. You could even add a database trigger on insert to auto-convert fields to text, so reads require zero transformation.
Option 2: Add Target Rows Using Column Captions
One question that comes up immediately after building a formatted pivot-style table: where do you show targets or benchmarks alongside actuals? One elegant answer is Retool's column caption feature. You can map a secondary value — like a monthly target — to appear as a caption beneath the main cell value. Here's the general approach:
- Run a separate query to fetch your targets by month or category.
- In your
Tablecolumn settings, set the caption field to a JavaScript expression that looks up the matching target from your secondary query result. - Format the caption value with the same JavaScript string-formatting logic you're using for your main data.
This keeps your targets visually attached to their actuals without adding extra rows or blowing up your query logic. The result is a clean, Excel-style layout that clients — especially those accustomed to spreadsheets — will immediately understand.
Option 3: Build a Custom Pivot Table Component
If you need a true pivot table with dynamic row/column reshaping, the only reliable path in Retool today is a custom component. Several community members have taken this route using lightweight pivot libraries. The most battle-tested option mentioned by long-time Retool builders is pivot.js — it's minimal, fast, and doesn't consume much screen real estate.
Steps to implement a custom pivot table component in Retool:
- Create a new Custom Component in your Retool app.
- Load
pivot.jsvia a CDN script tag inside the component's HTML. - Pass your query data into the component using Retool's
modelobject. - Initialize the pivot with your dataset and define which fields are rows, columns, and values.
- Use
Retool.subscribeto re-render the pivot when the underlying data changes.
One gotcha to watch for: rendering issues when the component reloads. If you're attaching to the DOM manually, using hydrateRoot instead of ReactDOM.render can help avoid stale root conflicts. For non-React pivot libraries like pivot.js, you can skip this entirely and call the library's render method directly on a target div.
Option 4: Horizontal List View for Month-Based Layouts
Another approach worth considering — especially for time-series data broken out by month — is a horizontally oriented List View component. You create a narrow List View instance that renders one month's data as a column, then repeat it across a container. This gives you a spreadsheet-like layout without the column-type constraints of the native table.
The trade-off: List Views don't look like tables, and if your users live in Excel, the visual difference can cause friction. For internal finance or ops tools where users expect a grid, the string-formatted Table or custom component approach will feel more natural.
Which Approach Should You Use?
- Quick fix, minimal effort: Format everything as strings in a SQL view or JavaScript transformer, use column captions for secondary metrics.
- Medium effort, polished result: Build a custom component with
pivot.js— reusable as a Retool module across apps. - PostgreSQL-heavy stack: Write a dynamic pivot function in Postgres using
crosstabor a customCASE-based pivot, and send the pre-pivoted result straight to a standard Retool table.
The Retool community is actively building better solutions here, including reusable pivot modules. Until Retool ships a native pivot table component, combining pre-formatted queries with custom components is the most reliable path to a production-ready result.
Ready to build?
We scope, design, and ship your Retool app — fast.